
-
Email info@jnans.org
-
Address 848 N. Rainbow Blvd. #5486 Las Vegas, NV 89107, USA
1Senai Cimatec University, Salvador, Brazil.
2State University of Bahia, Alagoinhas, Brazil.
3State University of Feira de Santana, Bahia, Brazil.
*Corresponding author: Florêncio Mendes Oliveira Filho
Senai Cimatec University, Salvador, Brazil.
Email ID: florencio@fieb.org.br
Received: Jun 01, 2026
Accepted: Jun 18, 2026
Published Online: Jun 25, 2026
Journal: Journal of Neurology and Neurological Sciences
Copyright: Filho FMO et al. © All rights are reserved
Citation: Filho FMO, dos Santos Silva EF, de Araujo Fontoura JR, Zebende GF. DBS/L-dopa condition in a Parkinson’s patient with a subthalamic nucleus implant: An evaluation using rms ∆ log FDFA function. J Neurol Neuro Sci. 2026; 2(1): 1028.
Introduction: The mechanism by which low- or high-frequency Deep Brain Stimulation (DBS) attenuates tremor and other symptoms of Parkinson’s disease remains unknown, especially in patients with electrodes implanted in the subthalamic nucleus.
Objective: To quantitatively evaluate the differences in the amplitudes of atypical DBS-L-dopa interaction fluctuations in resting tremor in a Parkinson’s disease patient undergoing DBS of the subthalamic nucleus, considering two stimulation conditions (on-off) and two pharmacological conditions (L-dopa on-off).
Methods: Tremor was recorded for approximately 60 seconds in eight experimental conditions: DBS on/off × medication (L-dopa) on/off; and at four time points (15, 30, 45, and 60 minutes) after DBS was turned off for 60 minutes (without medication). Detrend Fluctuation Analysis (DFA) was applied to assess auto-correlation, and the rms function ∆ log FDFA was used to evaluate differences in amplitude variations.
Results: DFA revealed antipersistence (αDFA<0.5), noise 1/f (αDFA≈1), and nonstationarity (αDFA>1) under the ren, ref, ron, and rof conditions. The ∆ log FDFA metric captured subtle differences at 15, 30, 45, and 60 minutes, complementing the traditional analysis.
Conclusions: The combined DFA-rms approach ∆ log FDFA provides an objective measure of the effects of DBS and levodopa, adding value to the clinical scales (UPDRS and TRS) used in the postoperative evaluation of subthalamic implants.
Keywords: Parkinson’s; Levodopa (L-dopa); Subthalamic Nucleus (STN); rms ∆logFDFA.
Parkinson’s disease is considered a systemic disease that begins with the death of nerve cells specialized in producing and releasing dopamine, a neurotransmitter fundamental to various functions of the central nervous system [1,2]. One of the main characteristics of this disease is related to the progressive loss of dopaminergic neurons in the substantia nigra of the midbrain and is associated with motor symptoms, including resting tremor, bradykinesia, and rigidity [3,4].
Depending on the stage of Parkinson’s disease, the tremor becomes more harmonic, its frequency shifts to a lower range (4-6 Hz), its amplitude increases, the oscillation pattern changes, and it exhibits fluctuations on an atypical time scale [5]. The changes are subtle and intermittent, disappearing in cycles and tending to become more evident as the disease progresses [6,7].
For patients with this disease who have been diagnosed for more than 4 years, have a good response to levodopa, refractory symptoms with optimized medication, preserved cognitive functions, and favorable general clinical conditions, Deep Brain Stimulation (DBS) surgery is recommended https://www.nice. org.uk/guidance/ipg382/information for public. Since it is not a cure but a therapeutic option, the response to the invasive procedure is effective and safe, improving motor response and achieving its main objective, which is to improve the patient’s quality of life [2,7,8].
Even after Parkinson’s disease, patients undergoing DBS surgery may still require the use of Levodopa (L-dopa). The combination of DBS and L-dopa stimulation improves motor control, reduces fluctuations and dyskinesias, and eventually eliminates the need for high medication doses. To achieve this control, monitoring is conducted using the subjective Unified Parkinson’s Disease Rating Scale (UPDRS) and Tremor Rating Scale (TRS), which are balanced by the expertise of a neurologist seeking the best combination of DBS and L-dopa stimulation [2].
A recent study evaluated the resting tremor velocity of the index finger in 16 individuals with Parkin-son’s disease who received high-frequency electrical deep brain stimulation, unilaterally and bilaterally, in three targets: Ventro-Intermediate thalamus (Vim), internal globus pallidus (GPi), and Subthalamic Nucleus (STN) [6]. Two groups were analyzed: High-Amplitude (HAT) and Low-Amplitude (LAT). The study considered eight possibilities: deep brain stimulation on with medication on, deep brain stimulation on with medication off, deep brain stimulation off with medication on, deep brain stimulation off with medication off, and especially deep brain stimulation off for 15, 30, 45, and 60 minutes with medication off [6,9,10].
The methodology employed was the association of the Detrended Fluctuation Analysis (DFA) method with Shannon Entropy (H). Two points were verified in the study, the first identifying behavioral transitions with a typical time scale and the second providing information about the uncertainty in the tremor’s position.
Even though it is an innovative research study [9] with important methodological contributions, the difference in fluctuation amplitude between the eight possibilities mentioned, considering two conditions (on/off) mentioned above for the same self-affinity scaling process, had not yet been explored. Given this gap, in this study we propose to investigate, in a reduced domain, the fluctuation amplitude via the rms function ∆logFDFA with the aim of quantifying the relationship between Levodopa (L-dopa) combined with DBS electrical brain stimulation in the Subthalamic Nucleus (STN) target.
For the test performed with the rms function, we will use the publicly available database, available at:
https://physionet.org/content/tremordb/1.0.0/
The database provides recordings of resting tremor velocity data from the index finger of 16 individuals diagnosed with Parkinson’s Disease (PD) who received high-frequency chronic Deep Brain Stimulation (DBS), unilaterally and bilaterally.
Since this is a statistical test, and a pioneering one for this subject (DBS/L-dopa) with the rms function (∆logFDFA), we will only use patient (S016). The reason for the choice is associated with tremor patterns with good signal quality and low noise, as well as temporal stability when compared to other patients in the group who receive chronic high-frequency deep brain stimulation targeting the Subthalamic Nucleus (STN). A priori, this is a patient with rigidity and dyskinesias. Figure 1 illustrates, in red dots, the candidate region for the surgical procedure of the subcortical electrode in the structure of the Subthalamic Nucleus (STN).
Detailed information and descriptions of all patients in the database, such as: subject, age of the group, gender, target stimulation frequencies, intensity (volts), and other patient-specific parameters, can be found in PhysioNet [11]. Details of the original signal with minimum, maximum, and average values can also be viewed in Figure 2.
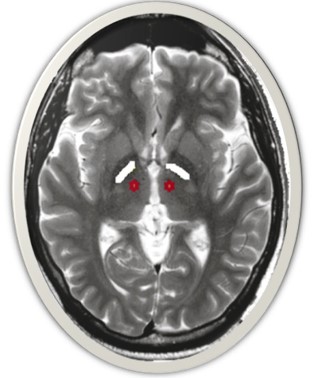
The subthalamic nucleus (STN)
Described by Jules Bernard Luys in 1865, the Subthalamic Nucleus (STN), also known as the Corpus Luysii, is an ovoid diencephalic structure located ventrally to the thalamus [12]. The STN plays a fundamental role in the functioning of the basal ganglia circuits [12-14]. From a physiopathological perspective, it is considered a key structure, as its dysfunction is directly associated with several neurological disorders [15,16].
Over the past decades, the STN has become a relevant target for Deep Brain Stimulation (DBS) in the treatment of Parkinson’s disease, with the aim of modulating neuronal firing patterns and, consequently, improving both the understanding of the disease and its clinical manifestations. Its activity is essential for the regulation of motor function and is also involved in cognitive and emotional processes through its connections with associative and limbic circuits. Furthermore, the STN plays a critical role in the modulation of neural circuits, particularly within the indirect and hyper direct pathways of the basal ganglia [17,18].
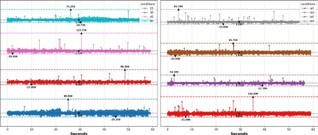
Patient: S016 - DBS / L-dopa
• Patient S016 (age 37, female, with disease latency between 1981-1992) has a recording of approximately 60 seconds of resting tremor of the left index finger. Medication on, implies 150% of her morning dose of L-dopa and receiving effective stimulation in the STN, categorized into eight conditions:
• res: Deep brain stimulation on (DBS), L-dopa medication on (samples = 6300).
• ref: Deep brain stimulation on (DBS), L-dopa medication off (samples = 7128).
• ron: Deep brain stimulation off (DBS), L-dopa medication on (samples = 6696).
• rof: Deep brain stimulation (DBS) off, L-dopa medication off (samples = 6594).
• 15: Deep brain stimulation (DBS) off for 15 minutes, L-dopa medication off (samples = 6486).
• 30: Deep brain stimulation (DBS) off for 30 minutes, L-dopa medication off (samples = 6588).
• 45: Deep brain stimulation (DBS) off for 45 minutes, L-dopa medication off (samples = 6744).
• 60: Deep brain stimulation (DBS) off for 60 minutes, L-dopa medication off (samples = 7302).
Detrended fluctuation analysis (DFA)
For the purpose of analyzing the time series of resting tremor velocity in the index finger, here specifically in high-frequency chronic deep brain stimulation (DBS), unilaterally or bilaterally, we will provide a brief description of the DFA method and the Fluctuation Function - rms (∆log).
To understand the method proposed by Peng [19], consider a sample of correlated signal u (i) (DBS signal), where i = 1, · · ·, N, where N is the total number of points in the time series. We integrate the signal u(i) and obtain y(k)=Σk [u(i)−< u >], where < u > is the mean of u(i).
The integrated signal y(k) is divided into boxes (without overlap) of the same size n (time scale). For each box of size n, we fit yn(k) in each box using a first-order linear regression, which represents the trend. The entire process is obtained by the least squares method. The integrated series y(k) is subtracted from the fitted series yn(k) in each box size n. Then, for each box of size n, the root mean square will be calculated, that is,

The procedure is repeated for a wide range of scales, that is, 4 ≤ n ≤ N/4. Next, the function FDFA characterizes a power law of the type FDFA ~nαDFA, where αDFA will be the long-range correlation indicator.
The interpretation of the relationship is given as follows: αDFA<0.5 (anti-persistent signal), αDFA = 0.5 (uncorrelated white noise), αDFA>0.5 (persistent signal - long-range correlation), αDFA≃1, (1/f noise), αDFA>1 (non-stationary) and αDFA≃3/2 (Brownian noise).
The DFA method enables the detection of long-range correlation and embedded self-affinity in apparently non-stationary time series and, above all, avoids the spurious detection of long-range correlations [9,20,21,22,23].
Rms function ∆LogFDFA
The root mean square fluctuation function (rms) arises with the intention of measuring the difference in amplitude fluctuation between two EEG channels [20]. The tool is an enhancement given to the DFA method and has proven to be very useful in the application of electrophysiological signals. Through this function (rms), we can study how much two brain regions are correlated to the same scale (temporal coherence) [9,21,22,23].
The first step consists of calculating the DFA of two time series and their logarithms individually.
Then, subtract the result from the logarithms. See equation 2.

From the function ∆logFDFAx,y we can infer that the amplitude of the fluctuation relative to rms
• Can be viewed through three conditions: If logFDFAx,y> 0, then the amplitude of the rms fluctuation function around x with respect to y is greater;
• If ∆logFDFAx,y=0, then the amplitude of the rms fluctuation function around x with respect to y is zero;
• If ∆logFDFAx,y<0, then the amplitude of the rms fluctuation function around x with respect to y is smaller.
To test the effects of Deep Brain Stimulation (DBS) combined with L-dopa medication in a patient diagnosed with Parkinson’s disease, using resting tremor velocity of the index finger with an implant in the STN target, bilaterally, we applied the Detrended Fluctuation Analysis (DFA) method and the rms function ∆logFDFA. For this, we used time series of approximately 60 seconds, with the patient classified as having low-amplitude tremor. We began by investigating the DFA results for the case where patient S016 tested the following conditions: DBS on and L-dopa on (ren), DBS on and L-dopa off (ref), DBS off and L-dopa on (ron), and DBS off and L-dopa off (rof). Following the same procedure, we evaluated the results: DBS off for 15, 30, 45, and 60 minutes, all with L-dopa interrupted for 60 minutes (without medication).
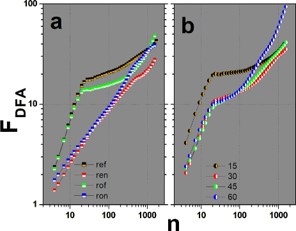
For both conditions, we calculated the autocorrelation exponent αDFA. The results are presented in tables 1 and 2. For the first condition, table 1, described in Figure 3(a), three conditions were verified: ref showed non-stationary behavior (αDFA>1.0) accompanied by antipersistence (αDFA0.5). rof showed non-stationary behavior (αDFA>1.0) accompanied by antipersistence (αDFA<0.5) followed by persistence (αDFA>0.5). ren showed antipersistence behavior (αDFA<0.5) for all scales. ron, on the other hand, showed persistent behavior (αDFA>0.5) for all scales. For the second condition (b), three behaviors were also verified: 15 showed non-stationarity (αDFA>.0) accompanied by antipersistence (αDFA<0.5). 30 repeats condition 15, non-stationarity (αDFA1.0) accompanied by antipersistence (αDFA<0.5). [45] also follows the condition of 15 and 30. 60 showed persistence (αDFA>0.5) accompanied by antipersistence (αDFA<0.5), and finally persistence (αDFA>0.5). So far, the results are consistent with the literature presented in [9].
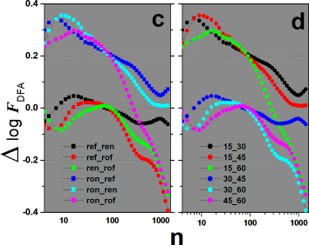
With an analysis not yet presented in the literature for this type of study (effect: DBS / L-dopa), we calculated the amplitude of the fluctuation via the rms function ∆logFDFA. In figure 4(c), we verified that the difference for ref-ren, ref-rof and ren-rof, on small scales (n=4), showed fluctuations below zero while for ron-ref, ron-ren and ron-rof the fluctuations are positive and above 0.2.
Still in (c), it is observed that, as the scale n increases, all conditions tend to decrease. The combinations ron–ref and ron–ren remain positive, whereas ron–rof exhibits a negative behavior after n=100, following the patterns observed for the pairs ref–ren, ref–rof, and ren–rof. In (d), the same behavioral pattern is also observed. The combinations 15–30, 15–45, and 15–60 show differences at small scales (n=4), with positive fluctuation amplitudes exceeding 0.2, whereas 30–45, 30–60, and 45–60 exhibit amplitude differences with values below zero. Thus, as the scale n increases, these differences tend to decrease. Special attention is given to the pair 15–60, which, after n=100, follows the same behavior as the pairs 30–45, 30–60, and 45–60.
Even with a well-defined and known pattern and behavior, converging with what the literature shows in terms of autocorrelation with the DFA method [19, 9], in this study we focus on understanding this combination in three characteristic time scales 4 < n < 10, 10 < n < 100 and 100 < n < 1000. The reasons for choosing the scales are related to the phase transitions in the fluctuations and how they vary around ∆logFDFA=0 (Figure 4).
We observed that the L-dopa (on–off) and DBS (on–off) combinations exhibit similarities in both the waveform shape and the overall curve behavior, although subtle differences may be identified depending on the specific combination analyzed. To investigate these small variations, we compared the values reported in Tables 5 and 7. It is worth noting that the differences observed in these tables arise from the calculations associated with the αDFA exponent (Table 4) and the rms function ∆ log FDFA (Table 6).
Consistently and innovatively combining Levodopa/ DBS with DFA autocorrelation and Shannon entropy (H) in resting tremor velocity recordings in Parkinson’s disease patients undoubtedly demonstrates a fantastic contribution, especially as a methodological complement to the UPDRS and TRS scales. However, the subtlety of the fluctuations and intermittent differences remains a point of discussion in scientific communities investigating chronic and progressive neurodegenerative disorders.
| 4 < α1 < 23 | 24 < α2 < 223 | α3 > 223 | |
|---|---|---|---|
| S16 ref | 1.15 ± 0.02 | 0.21 ±0.02 | 0.21 ±0.02 |
| S16 ren | 0.47 ± 0.02 | 0.47 ± 0.02 | 0.47 ± 0.02 |
| S16 rof | 1.12 ± 0.02 | 0.10 ± 0.01 | 0.56 ± 0.01 |
| S16 ron | 0.53 ± 0.01 | 0.53 ± 0.01 | 0.53 ± 0.01 |
| 4 < α1 < 60 | 60 < α1 < 135 | α3 > 135 | |
|---|---|---|---|
| S16 15 | 1.03 ± 0.03 | 0.07 ± 0.01 | 0.29 ± 0.01 |
| S16 30 | 1.02 ± 0.02 | 0.15 ± 0.01 | 0.43 ± 0.01 |
| S16 45 | 0.87 ± 0.01 | 0.23 ± 0.01 | 0.43 ± 0.01 |
| S16 60 | 0.93 ± 0.01 | 0.22 ± 0.01 | 0.71 ± 0.01 |
Based on this gap, this preliminary study presents, in a reduced domain (eight conditions), the analysis of the response in a candidate with an electrode implanted in the subcortical structure in the Subthalamic Nucleus (STN). We show that it was possible to quantify, compare, and differentiate all L-dopa (on-off) x DBS (on-off) conditions of the tremor suppression mechanism based on resting tremor velocity data of the index finger.
The analysis takes into account how each combination is associated given the stimulus/medication relationship. We recorded the conditions in the table 3. In this table, we verified the behavior of the combination and observed that the influence of the L-dopa or DBS medication changes as the scale (n) increases. To understand this relationship, also described in the table 3, we took: ref (DBS on / L-dopa off) - ren (DBS on / L-dopa on). We observed at this point that for small scales (4 < n < 10) and large scales (100 < n < 1000), ren (DBS on / L-dopa on) responds better than ref, while for medium scales (10 < n < 100) ref (DBS on / L-dopa off) responded better. The response can also be verified when we calculate DBS off 15 L-dopa off - DBS off 30 L-dopa off. Regardless of the scale (n), it is observed that the response, DBS off 15 L-dopa off (interrupted for 60 minutes (without medication)), prevails, revealing that the medication acts for the entire observed period.
Another piece of information seen in Figure 4 is that, regardless of the condition (on/off) for DBS and L-dopa, the curves decrease with increasing scale (n) for all situations presented: ref, ron, rof, ren, 15, 30, 45, and 60. Situations also associated with the two conditions: ref-ren ≈ 30-45; ref-rof ≈ 15-60; ren-rof ≈ 15-60; ron-ref ≈ 15-30; ron - ren ≈ 30-60 and ron - rof ≈ 45 - 60. Details of these differences can be found, for comparison purposes, in the spreadsheets presented in the supplementary material: 4,5, 6 and 7.
In this study, we aimed to evaluate, by means of the Detrended Fluctuation Analysis (DFA) method and the rms function ∆ log FDFA, still open questions regarding the response to the combination of Levodopa and Deep Brain Stimulation (DBS) in a patient with Parkinson’s disease. The patient received an implant in the Subthalamic Nucleus (STN) with the objective of suppressing tremor and reducing other PD-related symptoms.
| S016 | 4 < n < 10 | 10 < n < 100 | 100 < n < 1000 |
|---|---|---|---|
| ref (DBS on / L-dopa off) ren (DBS on / L-dopa on) | ren | ref | ren |
| ref (DBS on / L-dopa off) rof (DBS off / L-dopa off) | rof | ref | rof |
| ren (DBS on / L-dopa on) rof (DBS off / L-dopa off) | rof | rof | rof |
| ron (DBS off / L-dopa on) ref (DBS on / L-dopa off) | ron | ron | ron |
| ron (DBS off / L-dopa on) ren (DBS on / L-dopa on) | ron | ron | ron |
| ron (DBS off / L-dopa on) rof (DBS off / L-dopa off) | ron | ron | rof |
| DBS off 15 L-dopa off DBS off 30 L-dopa off | 15 | 15 | 15 |
| DBS off 15 L-dopa off DBS off 45 L-dopa off | 15 | 15 | 15 |
| DBS off 15 L-dopa off DBS off 60 L-dopa off | 15 | 15 | 60 |
| DBS off 30 L-dopa off DBS off 45 L-dopa off | 45 | 30 | 45 |
| DBS off 30 L-dopa off DBS off 60 L-dopa off | 60 | 30 | 60 |
| DBS off 45 L-dopa off DBS off 60 L-dopa off | 60 | 60 | 60 |
To understand the increased amplitudes and atypical temporal fluctuations, we evaluated eight possible combinations for the conditions L-dopa (on–off) and DBS (on–off). We analyzed the autocorrelation of each response and identified that, depending on the scale (4 < n < 10, 10 < n < 100, and 100 < n < 1000), the responses may exhibit distinct regimes, such as reference behavior, non-stationarity (αDFA>1), and anti-persistence (αDFA<0.5). These characteristics were also observed in the conditions ren, rof, and ron. Similar results were found for the 15-, 30-, 45-, and 60-minute intervals with DBS interrupted for 60 minutes (medication off).
To investigate subtle and intermittent changes, we computed the differences between the conditions ref, ren, rof, ron, and 15, 30, 45, and 60. Depending on the scale and specific time periods, these differences allow a better understanding of the shared contributions of Levodopa and DBS. In this context, we identify a differential feature that has not yet been explored using the rms function ∆ log FDFA. Another observed result was the similarity of responses across the different cases analyzed.
This study should be considered preliminary, since the analysis was conducted on a single patient. The most widely used clinical assessment tools for this type of analysis are the Unified Parkinson’s Disease Rating Scale (UPDRS) [1,5] and the Tremor Rating Scale (TRS) [3,5]. Both scales focus on rest, posture, intentional movements, and functional impact, and therefore do not capture the level of sub-tlety and detail provided by the DFA technique and the rms function ∆ log FDFA presented in this study.
As future work, we will reproduce the model presented here using the rms function ∆ log FDFA for all patients available in the database at https://physionet.org/content/tremordb/1.0.0/ who received chronic high-frequency electrical deep brain stimulation, either unilaterally or bilaterally, targeting one of the following structures the Ventro-Intermediate nucleus of the thalamus (Vim), the internal globus pallidus, or the subthalamic nucleus.
Acknowledgments: Florêncio Mendes Oliveira Filho thanks SENAI CIMATEC UNIVERSITY; Gilney Figueira Zebende acknowledges financial support from CNPq Grant 310136/2020-2.
Author contributions statement: All researchers participated in all aspects of the manuscript construction.
Abbreviations
DP: Parkinson’s disease; DBS: Deep brain stimulation; ECP: Deep brain stimulation; STN: Subthalamic nucleus; VIM: the internal Globus pallidus; GPi: the internal Globus pallidus; DFA: Detrended Fluctuation Analysis; L-dopa: Levodopa; LAT: Low Amplitude Tremor; HAT: High amplitude tremor; ren: Deep Brain Stimulation on, Medication on; ref: Deep Brain Stimulation on, Medication off; ron: Deep brain stimulation off, Medication on; rof: Deep Brain Stimulation off, Medication off; UPDRS: Unified parkinson’s disease rating scale; TRS: Tremor rating scale; EEG: Electroencephalogram.